


Five optimization lessons I'll use in the classroom from Gurobi's "Academics Changing the World" panel


Recently, Gurobi’s CEO, Duke Perrucci, hosted a panel discussion with professors Dick den Hertog, Özlem Ergun, and Karen Smilowitz. It was part of Gurobi’s outreach to non-profits.
Overall, it was a great discussion. Here are five lessons I’ll bring to my classes.
One: There are plenty of interesting non-profit or public sector problems.
The talk highlighted interesting work from locating schools, hunger relief (see point #2 below), and debris removal after a natural disaster. In a LinkedIn comment, Julie Aho pointed out that we should let students know there are interesting, large-scale optimization problems within the non-profit and government sector. This video lets students know that these opportunities exist.
Two: The diet problem has interesting applications!
In my Introduction to Optimization class, we cover the diet problem. It’s a classic linear program. I’ve always felt bad teaching it because it seemed irrelevant. Not anymore!
Dick den Hertog pointed out two great applications of the diet problem.
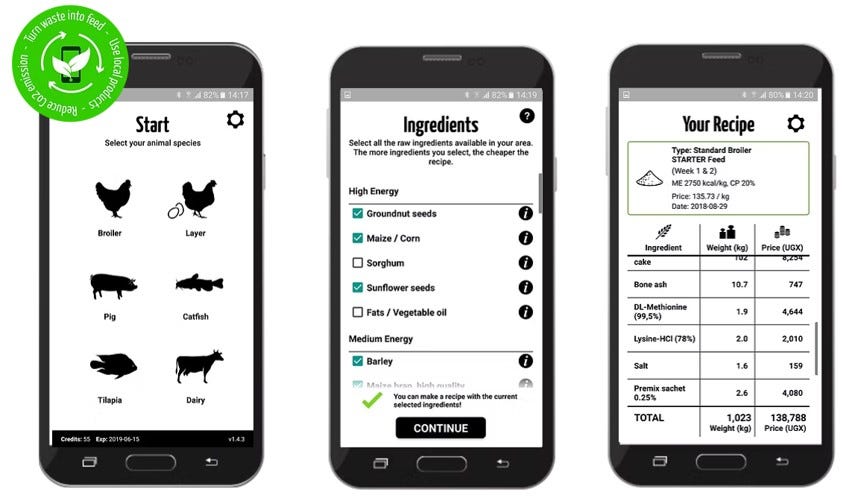
The first one is the most direct. He worked with an organization that built a free app for farmers in the developing world to figure out the best way to feed their livestock. It solves the diet problem under the hood.
The second use case was even more impactful. This came from the 2021 INFORMS Edelman Winner: the UN World Food Programme (hat tip to Karen Smilowitz for sending the video).
This is, overall, a great case. But I loved this quote in the middle of it:
“Our big break-through came in 2014 when we started integrating the supply chain models, that run from procurement to delivery, with the diet optimization problems that design the food basket…”
This is a great case for combining what students learn about the diet problem with supply chain models. All my future classes are going to hear about this one!
Three: “Get data without being annoying”
This quote came from Karen Smilowitz. The context was how to collect real-time data at the emergency medical tents during a large marathon. When the medical tents are the busiest, the people have the least time to collect data. However, you need the data to help allocate resources.
This is part of the art of modeling: What is the minimum amount of data you need to make reasonable recommendations?
This quote is good advice for any situation, not just emergencies. I’ve seen too many projects held up waiting for data that wouldn’t have a meaningful impact on the solution.
Four: Visualization and user interaction with the solution is important.
Özlem Ergun pointed out the importance of visualization in her work on large-scale debris removal. The tool showed the solution (what to clear first, what contractors to use) in a color-coded map. The color-coded map allowed the management team to make adjustments.
Karen Smilowitz made a similar point about using models for school location: it is more important for the community to interact with the model rather than any one answer from the model.
This is similar to the ideas in the book Serious Play. Recently, I mentioned this in a post about creating more conflict in supply chain models. However, the ideas apply to any model; the above two are great examples.
Five: Get data from all stakeholders, not just the dominant voices.
When building a model and determining what is important to include, it is easy to fall into the trap of listening to the dominant voices. In school location models, a handful of parents would dominate the conversation. In that project, they worked hard to create a process for getting feedback from everyone.
You have to watch this in any project. As a model builder, letting the people who will talk to you guide the work is easy. Make sure you get a more complete picture.
Couple nice nuggets in this one Mike, that I plan to re-use (what is the minimum amount of data...., and don't just listen to the dominant voices).